Is the Bitcoin Bull Run Over? A Balanced 2026 Look
Is the Bitcoin bull run over? The short, honest answer
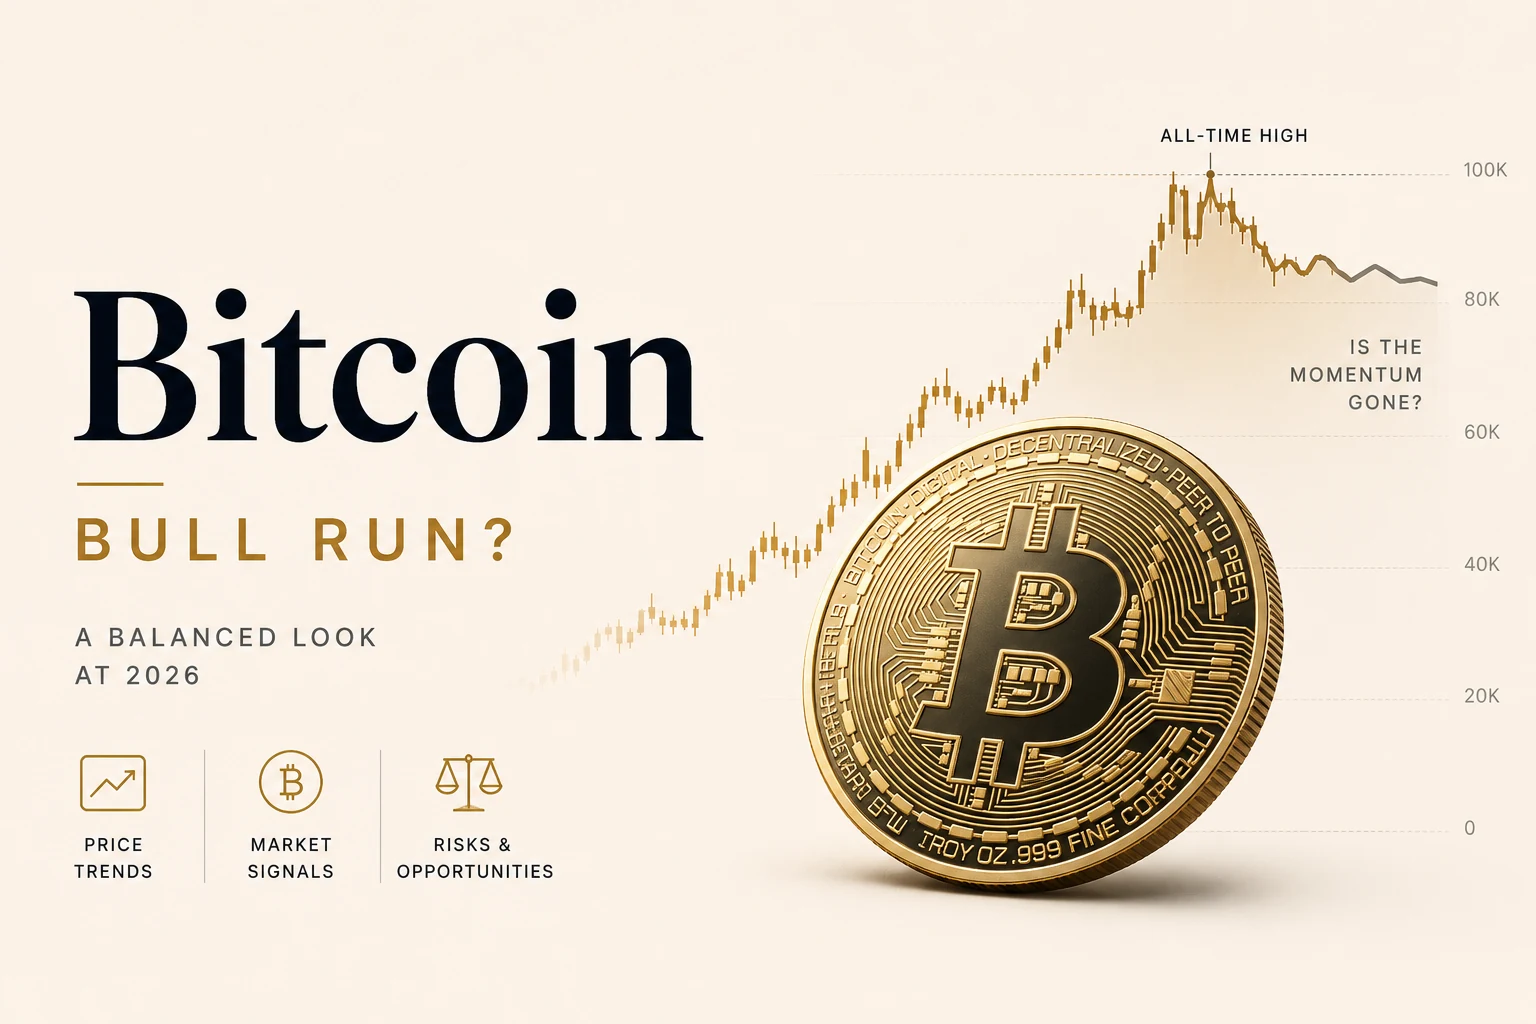
Nobody knows for certain whether the Bitcoin bull run is over, and anyone who tells you otherwise is selling a story. Here is what is not in dispute: Bitcoin set a record high near $126,198 on October 6, 2025, and as of June 22, 2026 it trades around $65,000, a decline of roughly 48%. That is a bear market by any normal definition. The real argument is whether this is the end of the cycle or a brutal correction inside one, and there are two serious, well-funded camps that read the same chart and reach opposite conclusions.
Last updated: June 22, 2026
This is general information, not financial advice. We will not give you a price target or tell you to buy or sell. What we will do is lay out the bear case and the bull case fairly, show what history actually says about drawdowns like this one, and flag the signals that would tip the argument one way or the other. If you want to model what a recovery or a deeper drop would do to a position, our ROI calculator lets you run the scenarios with your own numbers instead of someone else's hopes.
Why is Bitcoin falling? The setup
The drop did not come out of nowhere. Three forces have been pushing in the same direction since late 2025.
- ETF outflows. U.S. spot Bitcoin ETFs, which became the dominant marginal buyer during the rally, flipped to heavy selling. The week ending June 6, 2026 saw roughly $1.72 billion in net outflows, reported as the largest weekly exit since February 2025, with BlackRock's IBIT leading the redemptions. Money that flowed in on the way up has been flowing out on the way down.
- Leverage getting flushed. On June 4, 2026, Bitcoin briefly dropped below $62,000 as about $1.5 billion in leveraged long positions were liquidated. Forced selling like that tends to accelerate moves rather than cushion them.
- A less friendly macro backdrop. Strong U.S. jobs data reduced market expectations for near-term Federal Reserve rate cuts. When safer, yield-bearing bonds look more attractive, a non-yielding asset like Bitcoin loses one of its tailwinds.
None of that is unusual for a post-peak Bitcoin market. The question is what framework you use to interpret it.
The bear case: the four-year cycle says the top is in
For over a decade, Bitcoin has moved in a rhythm tied to its halving, the roughly every-four-years event that cuts the rate of new supply. The pattern is hard to ignore: major tops formed in late 2013, December 2017, and November 2021, with brutal bottoms following in early 2015, December 2018, and late 2022.
By that clock, an October 2025 top is almost suspiciously on schedule. The bear case argues that the bitcoin four year cycle is doing exactly what it always does: a euphoric blow-off high, followed by a long, grinding decline as late buyers capitulate. Fidelity's Jurrien Timmer, who studies these cycles closely, has pointed to a support zone in the $60,000 to $75,000 range as the kind of level a post-halving cooldown could test.
History backs up the idea that these declines can be deep and slow. Bitcoin fell about 84% in the 2018 bear market and roughly 77% in 2022. Measured against those, a 48% drawdown is not even unusual, it is arguably mild, which is the unsettling part of the bear argument: if this cycle rhymes with the last two, the move may not be finished. A genuine bitcoin bear market 2026 in the classic mold could last well into the second half of the year before finding a floor.
The bull case: the ETF era changed the rules
The other camp says the four-year cycle is a relic of a market that no longer exists, because the buyer base has fundamentally changed.
Their core point: in 2024, U.S. spot Bitcoin ETFs opened the asset to brokerage and retirement money that simply was not there in previous cycles. Grayscale, in its 2026 outlook, framed this as the "dawn of the institutional era" and argued the familiar halving-driven boom-bust may be giving way to a steadier "slow bull" that behaves more like gold or equities than the wild crypto of the past. Fundstrat's Tom Lee makes a related argument: that in the ETF era, structural fund demand, not the miner-issuance schedule, sets the marginal price, which in his view breaks the old playbook entirely.
There is data behind the thesis, not just optimism. Bitcoin's volatility has compressed meaningfully since the ETFs launched. And as Bloomberg Intelligence's Eric Balchunas has argued, ETF holders tend to be "more stable owners," which is part of why some analysts think an 80%-style drawdown is now less likely. The bull reading of 2026, then, is not "the top is in" but "a normal correction in a longer, calmer uptrend."
The honest counterpoint, which fair-minded bulls concede: ETFs cut both ways. In the February 2026 sell-off, the same ETF machinery that absorbed supply on the way up amplified the move on the way down, as redemptions added to the selling. Stable owners in calm markets are not always stable owners in a panic.
Bear case vs bull case, side by side
Bear case: "the top is in"Bull case: "the cycle changed"Core ideaThe four-year halving cycle is intact; October 2025 was the peakETF and institutional demand replaced the retail boom-bust patternKey backersFour-year-cycle analysts; Fidelity's Jurrien Timmer (support $60K–$75K)Grayscale ("institutional era"), Fundstrat's Tom Lee, parts of JPMorganWhat history suggestsPast bears fell 77%–84%; 48% so far may be incompleteVolatility has compressed since ETFs launched in 2024Reading of ETF flowsOutflows confirm the buyer base is exhaustedOutflows are a macro-driven pause, not the end of structural demandWhat would confirm itA decisive break below the February 2026 low (~$60K) that holds, with continued outflowsA reclaim of prior highs on sustained, positive ETF inflowsWhat would weaken itA strong, durable recovery to new highsA long, grinding decline well below $60K into late 2026
Notice that both columns are reading the same facts. That is the whole point: as of June 22, 2026, the evidence genuinely supports more than one story.
Where could Bitcoin bottom? (And why that question is a trap)
"Where will it bottom" is the most-asked question and the least answerable one. Support levels are observations about where buyers showed up before, not guarantees they will show up again.
That said, here is the landscape analysts are watching, framed as scenarios rather than predictions:
- The $60,000 area is the line in the sand. Bitcoin found a low near there in February 2026 and bounced, so a clean break that holds below it would be read by many as a meaningful shift toward the bear case.
- Some technical analysts flag the $50,000 to $55,000 zone as a deeper-correction scenario, often citing long-term moving averages like the 200-week.
- On the other side, a sustained move back above prior highs on positive ETF flows would be the clearest evidence the bull case is winning.
Any of these can happen. Bitcoin can wick below a level and reverse, or slice through it. Treat every number here as "what people are watching," not "what will happen."
What this means for you
You do not have to pick a side in the cycle debate to make a sensible decision. A few durable principles outlast any single forecast:
- Position size is the real risk control. The oldest rule in this asset class still holds: never invest money you cannot afford to lose. A 48% drawdown is survivable if it is 5% of your net worth and catastrophic if it is everything.
- Timing the exact bottom is a losing game for almost everyone. This is why dollar-cost averaging, investing a fixed amount on a schedule regardless of price, is the approach so often recommended for volatile assets. It trades the fantasy of a perfect entry for a process you can actually stick to.
- Decide your plan before the next move, not during it. The single most expensive mistake in past bear markets was emotional: panic-selling near a low or chasing a bounce with leverage. Writing down what you will do in advance removes the heat-of-the-moment decision.
- Run your own numbers. Before you act on anyone's "buy the dip" or "get out now," model it. Our ROI calculator shows what different recovery or drawdown scenarios would do to an investment, and our compound interest calculator helps you compare a volatile bet against the boring, predictable growth of steady contributions over time. Seeing the math is a useful antidote to a confident headline.
We are deliberately not telling you whether to buy the dip or sell. That decision depends on your timeline, your risk tolerance, and money you have not told us about. The tools are there to help you think clearly, not to nudge you.
Key takeaways
- As of June 22, 2026, Bitcoin trades near $65,000, down roughly 48% from its October 6, 2025 record of about $126,198, which is a bear market by definition.
- The drop has been driven by spot-ETF outflows (~$1.72B in one June week), leveraged liquidations (~$1.5B on June 4), and a macro backdrop less favorable to non-yielding assets.
- The bear case says the bitcoin four year cycle is intact and the top is in; the bull case says ETFs created a steadier "slow bull" that broke the old pattern. Both read the same data.
- History shows deeper Bitcoin drawdowns, 84% in 2018 and 77% in 2022, so 48% is not extreme by past standards, though that cuts in favor of caution, not comfort.
- No one can reliably call the bottom; $60K is the level most analysts are watching, but it is a scenario, not a forecast.
- For any bitcoin price prediction 2026 you read, including the bullish $250K calls and the bearish ones, treat it as opinion. This is general information, not financial advice, and you should never invest money you cannot afford to lose.
Try the tool from this post
ROI Calculator
Return on investment and annualized ROI.
Open ROI CalculatorFrequently asked questions
Nobody can prove it either way yet, and that is the honest answer. The cycle-broken camp, led by firms like Grayscale and Fundstrat, argues that steady ETF and institutional buying has replaced the retail boom-bust pattern, pointing to compressed volatility since 2024. The cycle-still-works camp notes that a top arrived in October 2025, right on the roughly four-year schedule, and that ETFs amplified February 2026's sell-off rather than absorbing it. As of June 22, 2026, the data fits both stories.
This is general information, not financial advice, and only you can answer that based on your goals and risk tolerance. What history shows is that Bitcoin has had several drops of 75% or more and recovered to new highs each time, but past recoveries do not guarantee future ones, and some assets never come back. The most commonly cited approach for volatile assets is dollar-cost averaging, buying a fixed amount on a schedule, which removes the pressure of timing a single bottom. Never invest money you cannot afford to lose.
No one knows, and anyone stating a precise number is guessing. Several analysts watch the $55,000 to $68,000 zone, citing the February 2026 low near $60,000 and long-term moving averages, but support levels are observations, not promises. Bitcoin can wick below a level and recover, or break it and fall further. Treat any 'bottom' figure as a scenario, not a forecast.
The decline from the October 2025 record has been driven by a mix of factors: persistent outflows from U.S. spot Bitcoin ETFs, leveraged long positions getting liquidated on the way down, and a macro backdrop where strong jobs data pushed back expectations for Federal Reserve rate cuts, making yield-bearing bonds more attractive than a non-yielding asset. It also lines up with the historical pattern of a post-halving cooldown.
By the common definition of a bear market, a drop of 20% or more from the high, Bitcoin is in one: it is down roughly 48% from its October 2025 peak as of June 22, 2026. Whether that is the end of the larger bull run or a deep correction within it is exactly the debate this article lays out. The label depends on which framework, the four-year cycle or the ETF-era thesis, ends up being right.
Bitcoin reached its record high of about $126,198 on October 6, 2025, and traded near $65,000 on June 22, 2026, a decline of roughly 48%. For context, that is a smaller peak-to-trough drawdown than the 84% seen in 2018 or the 77% seen in 2022, at least so far in this cycle.
Share this article
Send it to a teammate or save the link for later.
Related tools
Related articles

Anthropic Claude Max Lawsuit: Do You Get 20x?
A class action says Claude Max 5x and 20x don't deliver the advertised usage. Here's what the suit claims, how Max limits really work, and Pro vs Max.
Read article
ChatGPT Market Share 2026: Now Below 50% for First Time
ChatGPT market share 2026 fell to 46.4% as Gemini hit 27.7% and Claude 10.3%. See the full Sensor Tower numbers, why Gemini is gaining, and what it means.
Read article
GPT-5.6 Release Date: What's Leaked vs Confirmed
GPT-5.6 release date watch: prediction markets eye a June 22–28 window, but OpenAI has not confirmed it. What's leaked, the features, and how to prep.
Read article